Monitoring

Geting visibility into EmailEngine

Setting up Prometheus

EmailEngine allows monitoring via a Prometheus scraping endpoint. To enable it, you need first to generate an access token for Prometheus. To do so, click on the "Create new" button on the access tokens page in EmailEngine, uncheck "All scopes" in the form and check the "Metrics" scope before creating the token.

Next, set up a Prometheus scraping job. Use the newly generated access token as the value for the credentials field.

  - job_name: 'emailengine'
    scrape_interval: 10s
    metrics_path: '/metrics'
    scheme: 'http'
    authorization:
      type: Bearer
      credentials: 795f623527c16d617b106...
    static_configs:
    - targets: ['127.0.0.1:3000']

Next, restart the Prometheus service and check the "Targets" page in the Prometheus UI to see if it was able to pick up the metrics from EmailEngine or not.

Prometheus metrics

Here's a list of keys that EmailEngine includes in the Prometheus metrics output:

  • thread_starts (Counter) – Number of started threads
  • thread_stops (Counter) – Number of stopped threads
  • api_call (Counter) – Number of API calls [labels: "method", "statusCode", "route"]
  • imap_connections (Gauge) – Current IMAP connection state [labels: "status"]
  • imap_responses (Counter) – IMAP responses [labels: "response", "code"]
  • webhooks (Counter) – Webhooks sent [labels: "status", "event"]
  • events (Counter) – Events fired [labels: "event"]
  • webhook_req (Histogram) – Duration of webhook requests
  • queue_size (Gauge) – Queue size [labels: "queue", "state"]
  • queues_processed (Counter) – Processed job count [labels: "queue", "status"]
  • redis_uptime_in_seconds (Gauge) – Redis uptime in seconds
  • redis_rejected_connections_total (Gauge) – Number of connections rejected by Redis
  • redis_config_maxclients (Gauge) – Maximum client number for Redis
  • redis_connected_clients (Gauge) – Number of client connections for Redis
  • redis_slowlog_length (Gauge) – Number of of entries in the Redis slow log
  • redis_commands_duration_seconds_total (Gauge) – How many seconds spend on processing Redis commands
  • redis_commands_processed_total (Gauge) – How many commands processed by Redis
  • redis_keyspace_hits_total (Gauge) – Number of successful lookup of keys in Redis
  • redis_keyspace_misses_total (Gauge) – Number of failed lookup of keys in Redis
  • redis_evicted_keys_total (Gauge) – Number of evicted keys due to maxmemory limit in Redis
  • redis_memory_used_bytes (Gauge) – Total number of bytes allocated by Redis using its allocator
  • redis_memory_max_bytes (Gauge) – The value of the Redis maxmemory configuration directive
  • redis_mem_fragmentation_ratio (Gauge) – Ratio between used_memory_rss and used_memory in Redis
  • redis_key_count (Gauge) – Redis key counts [labels: "db"]
  • redis_last_save_time (Gauge) – Unix timestamp of the last RDB save time
  • redis_instantaneous_ops_per_sec (Gauge) – Throughput operations per second
  • redis_command_runs (Gauge) – Redis command counts [labels: "command"]
  • redis_command_runs_fail (Gauge) – Redis command counts [labels: "command", "status"]

Grafana dashboard

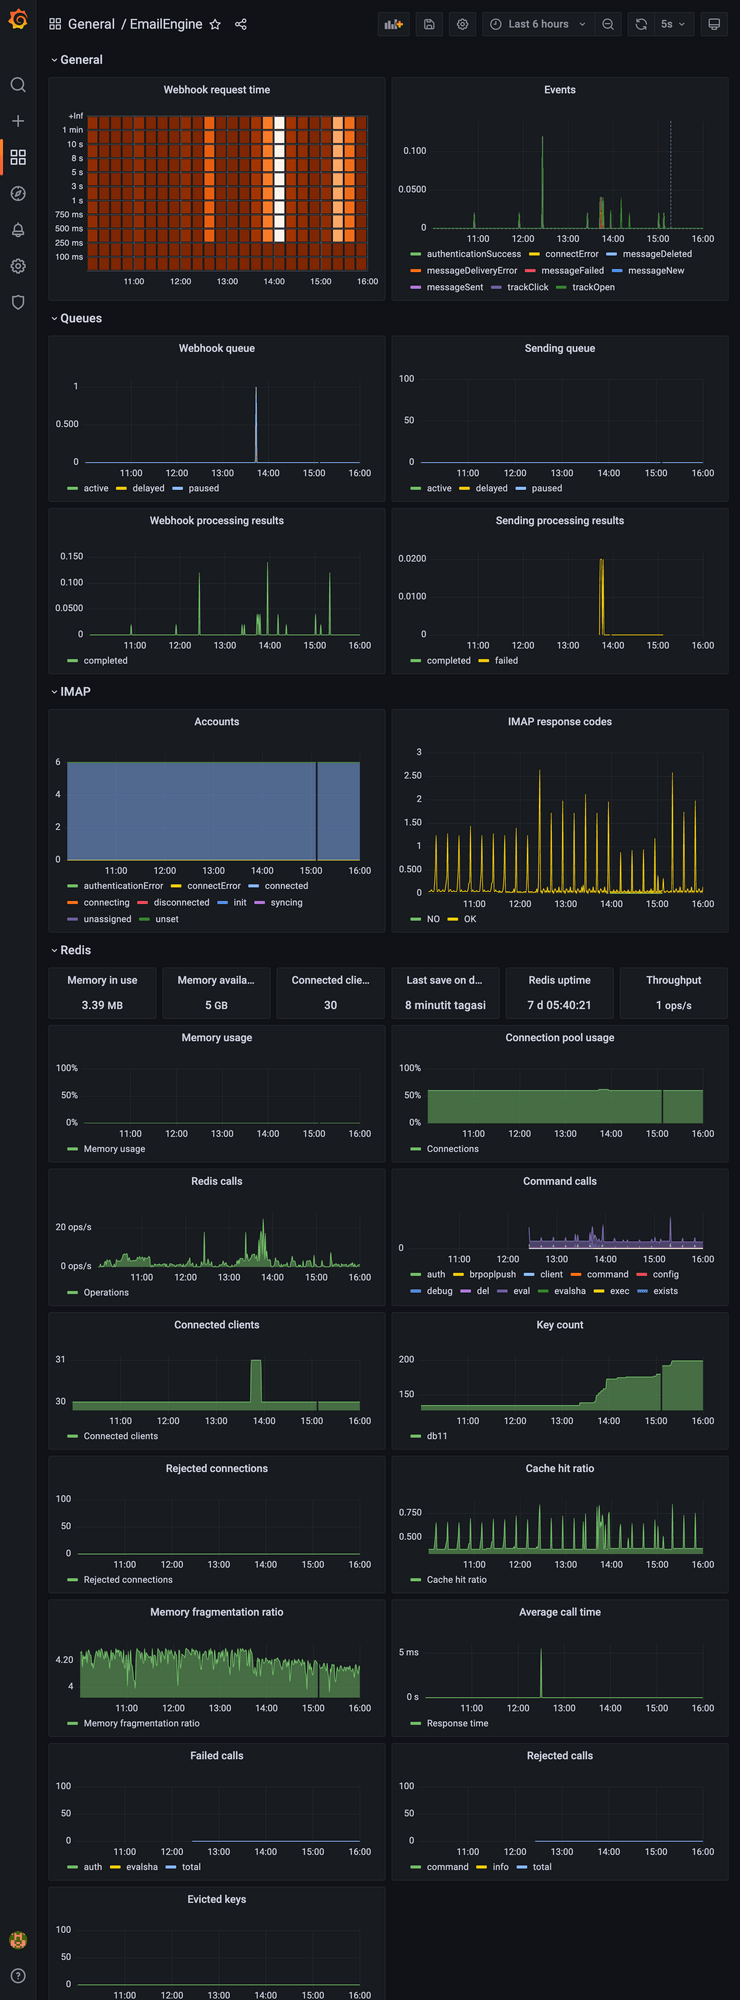
You can download the example Grafana dashboard definition for EmailEngine from here. See the contents of the dashboard from the screenshot below.

emailengine-grafana.png